
Fig. 4.
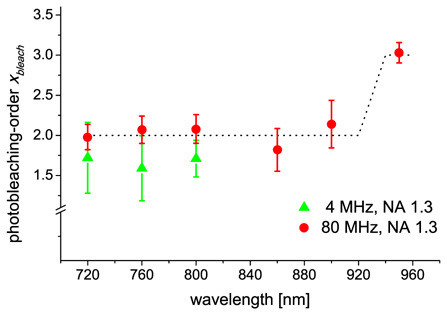
Wavelength-dependence of the photobleaching-order for Hoechst at different repetition rates. The dotted line illustrates its behaviour. Each data point represents the mean ± standard deviation of at least five experiments. The bleaching-order varied slightly around two from 720 up to 900 nm and increased to three at 950 nm.