Fig. 3.

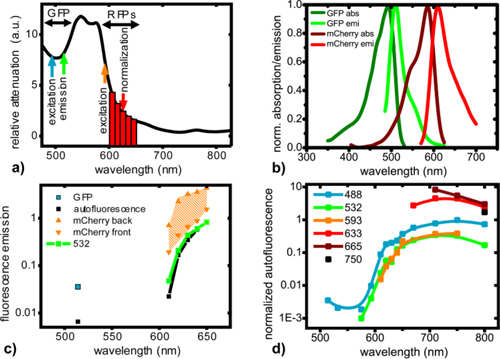
Characteristic fluorescence and autofluorescence emission curves in deep tissue imaging. (a) In vivo relative spectral attenuation of light transmitted through 8 mm thick mouse tissue (upper left torso). Arrows indicate key wavelengths: blue – GFP excitation at 488 nm, green – GFP emission at 514 nm, orange – RFP excitation at 593 nm, and red bars – RFP emission 610-650 nm. The red arrow indicates the laser wavelength used for the calculation of the n-Born ratio. (b) normalized absorption and emission spectra for GFP and mCherry, (c) Normalized fluorescence of 106 U87dEGFR glioblastoma cells expressing FPs from deep tissue in transillumination mode. The orange shaded area indicates the intensity range of mCherry emission. The mCherry RFP emission was significantly higher when cells were closer to the excitation source (orange triangles pointing upward), than when they were closer to the detector (orange triangles pointing downward). GFP emission (cyan square) was essentially independent from the position. Black squares and lines indicate the autofluorescence intensity (control cells) and green squares and triangles show the emission of mCherry when excited at 532 nm. Data were normalized for relative FP brightness. (d) In vivo normalized autofluorescence emission in transillumination of 12 mm thick mouse tissue (upper center torso) when excited at 6 different laser lines ranging from 488 - 750 nm (see color legend). The measurements were normalized for spectral window bandwidth, laser power, exposure time, i.e. units are photon counts.nm−1mW−1.s−1. The continuous lines are spline interpolations.
