Fig. 5.

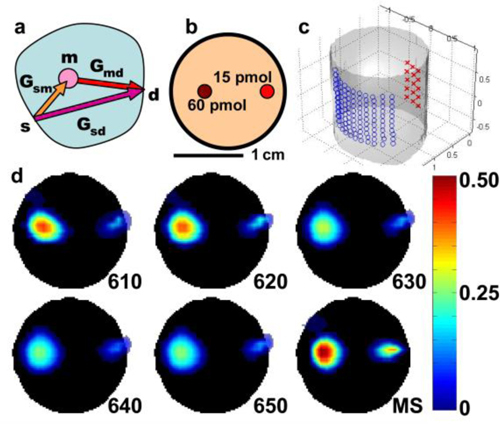
Multispectral fluorescence tomography reconstruction. (a) Schematic of the 3-wavelength n-Born ratio calculation. Here, s, m, and d are the source, mesh, and detector positions, respectively. Gsm, Gmd, and Gsd are the Green’s functions that model the corresponding propagating photon fields between s, m, and d. (b) Drawing of the cross section of the phantom containing 1% Intralipid and 1% whole blood. Small circles indicate the position of the two tubes containing 15 and 60 pmol of Texas Red fluorochrome. (c) A 3D view of the surface of the phantom with the positions of the sources (red crosses) and the detectors (blue circles) as projected on the surface. (d) Selected axial slices of the 3D single- and multi-spectral reconstructions of the fluorescence concentration (arbitrary units) of the two tubes inside the phantom. Black discs indicate the cross section of the phantom. (b) and (d) are on the same scale.
