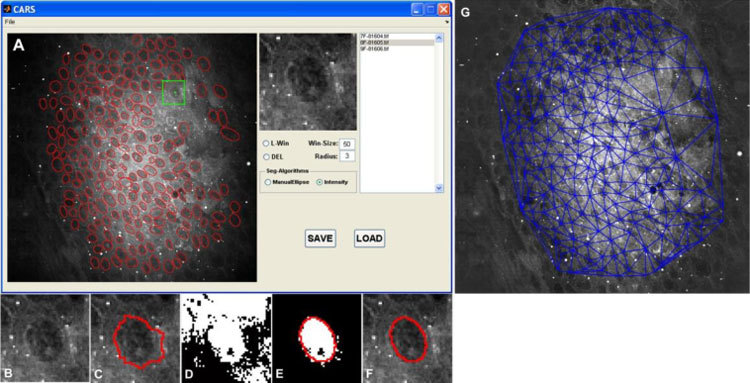
Fig. 5.

Overview of the nuclear segmentation process and the resulting Delaunay Triangulation graph. (A) Snapshot of graphic user interface of CARS image analysis software; Red ellipses are the delineated cell boundaries. The green star represents one of the user-selected points, while the green square box indicates the image patch which will be processed; intermediate results: (B) targeted nucleus; (C) watershed segmentation algorithm; (D) local thresholding; (E) Ellipse fitting; (F) final result. (G) Delaunay Triangulation on the segmented image.
