Fig. 3.

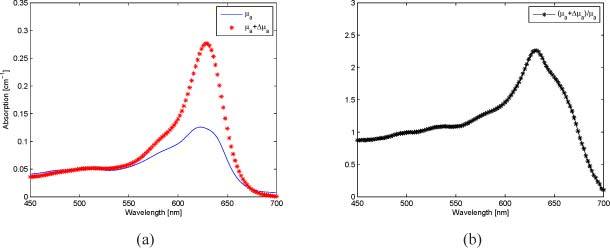
(a) Absorption spectra for the background, μa, and the inclusion, μa + Δμa, in experimental set 1, containing 10% ink and 90% dye. (b) Contrast between the background and the inclusion for experimental set 1.

(a) Absorption spectra for the background, μa, and the inclusion, μa + Δμa, in experimental set 1, containing 10% ink and 90% dye. (b) Contrast between the background and the inclusion for experimental set 1.