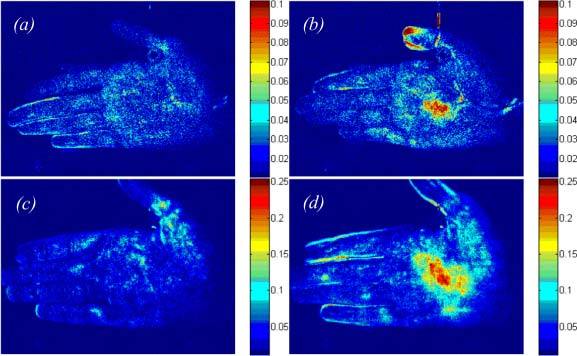
Fig. 7.

Distribution of blood-pulsations amplitude (a, c) before and (b, d) after gentle scratching of the palm of (a, b) subject A and (c, d) – subject B. The scales show the absolute value of the components of the correlation matrix SC(x,y), which are different for different subjects.
