
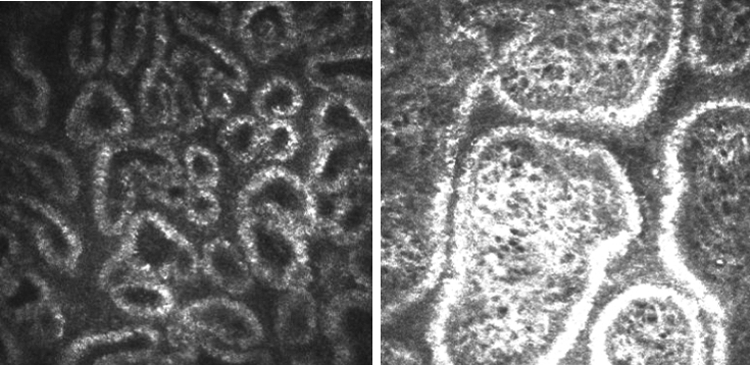
Figure 16.
In vivo confocal microscopy of meibomian glands, showing the dilatation of acinar units in a patient with obstructive meibomian gland dysfunction (right) compared to that in a healthy control (left) (courtesy of M. Dogru).
Official websites use .gov
A
.gov website belongs to an official
government organization in the United States.
Secure .gov websites use HTTPS
A lock (
) or https:// means you've safely
connected to the .gov website. Share sensitive
information only on official, secure websites.
In vivo confocal microscopy of meibomian glands, showing the dilatation of acinar units in a patient with obstructive meibomian gland dysfunction (right) compared to that in a healthy control (left) (courtesy of M. Dogru).