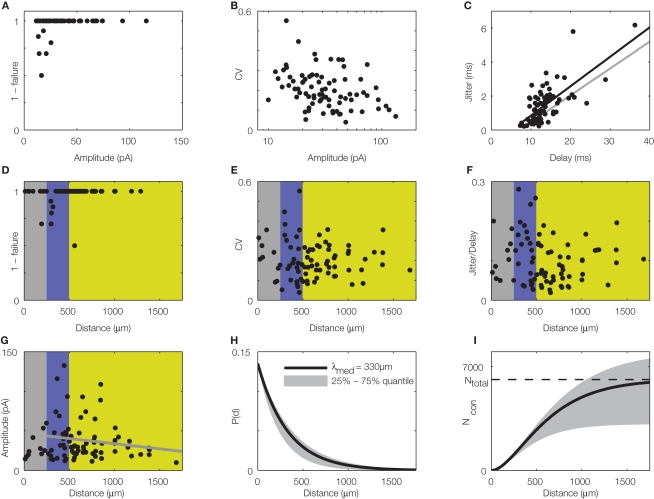
Figure 3.
Quantitative, physiological parameters of horizontal connections, determined by dynamic photostimulation (DPS). Presynaptic cells (n = 82) were stimulated by laser uncaging of caged glutamate (for details see Nawrot et al., 2009) to fire action potentials. Excitatory postsynaptic currents (EPSCs) were quantified in the cells receiving the projections. (A) Most projections were highly reliable, with failures only apparent in low amplitude EPSCs. (B) Relative amplitude variability, expressed as the coefficient of variation (CV) of the EPSC amplitude, had a clear tendency to decrease with increasing amplitude. (C) Temporal jitter, measured as the standard deviation of EPSC threshold crossing times after stimulation onset, scales with the delay between stimulation onset and EPSC onset. Quantification of timing of action potential generation for a set of directly stimulated cells (putative presynaptic cells) revealed that most of the jitter in EPSC timing was due to the variability in spike generation. Comparison of regression lines for presynaptic (gray) and postsynaptic (black) jitter suggests that only about 0.5 ms jitter is actually due to synaptic physiology. (D–G) Lateral distance from the stimulation site to the soma of the postsynaptic cells was extracted for each tested connection to evaluate possible distance dependence of physiological connection parameters. Failure rate (D), amplitude variability (E), and synaptic jitter (normalized to the total delay) (F) did not show any distance dependence, whereas amplitude (G) scaled negatively with distance. Colors correspond to cylindrical volumes, sketched in Figure 4 (H). To evaluate the lateral distance dependence of connection probability, we re-analyzed 17 mapping experiments, which were initially performed to find presynaptic sites for dynamic stimulation (compare to Figure 2B). Width of the scanning raster was 100 μm, and for each horizontal distance, we collected the number of sites, stimulation of which resulted in a postsynaptic EPSC. The ratio of this number relative to the total number of stimulations at the corresponding distance was taken as the estimated connection probability at that distance (n = 674 EPSCs in total). When stimulation sites were close to the soma or apical dendrite, EPSCs were often masked by large currents from uncaged glutamate impinging directly on the postsynaptic cell (direct responses). Probed distances where more than 20% of stimulated sites showed such direct responses were excluded from the analysis. Since it remains unknown how many neurons we stimulated at each target site and it was, thus, only possible to extract relative connection probabilities, we defined P100 = 0.1 at a distance of 100 μm, as suggested by paired recording studies (see Table 1). Our model of exponential decay is, thus, constrained as P(d) = P0 ·exp(−d/λ). Single fits were performed for each experiment, and length constants λ were extracted. The panel shows an exponential decay with a length constant equal to the median of all extracted λ-values (black trace), upper and lower shaded regions mark the 75 and 25% quantile, respectively. (I) Accumulated number of connected cells as a function of lateral distance d from the soma: we estimated the number of connected neurons within a cylindric volume with radius d as, with ρ = 60,000/mm3 (black trace) defining the cell density per cortex volume, fE = 0.85 representing the relative fraction of excitatory connections (Braitenberg and Schüz, 1998), and h = 1.3 mm defining the thickness of the gray matter. The estimated total number of presynaptic cells then amounts to Ntotal∞ ~ 6,100 with λ of 330 μm (black trace; shaded regions mark total cell numbers for respective λ taken from the shaded region in H).

