Fig. 3.
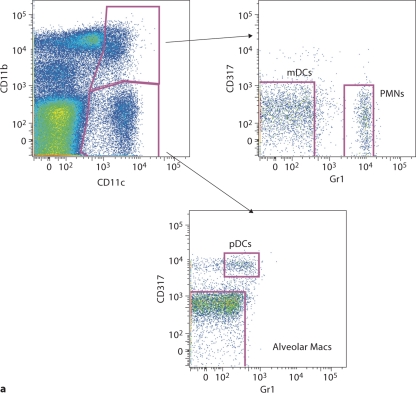
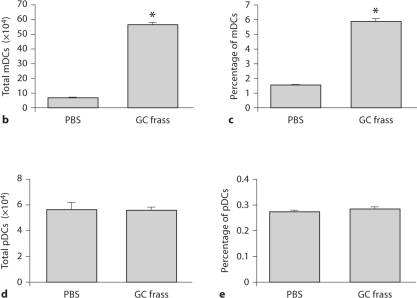
DC subsets in the lungs following mucosal exposure to PBS. Naïve mice were administered a single intratracheal instillation of PBS (40 μl) or GC frass (40 μg/40 μl) and whole lungs were isolated 24 h later. Cells were dissociated from the lungs and stained for flow cytometry analysis. a A representative flow cytometry plot showing the characterization of mDCs (CD11c+, CD11b+, Gr1neg, CD317neg) and pDCs (CD11c+, CD11bneg, Gr1low, CD317+). b Total mDCs. c Percentage of mDCs. d Total pDCs. e Percentage of pDCs. Values are means ± SEM, n = 16 mice/group; statistical analysis was performed by ANOVA (∗ p < 0.001 vs. PBS).


