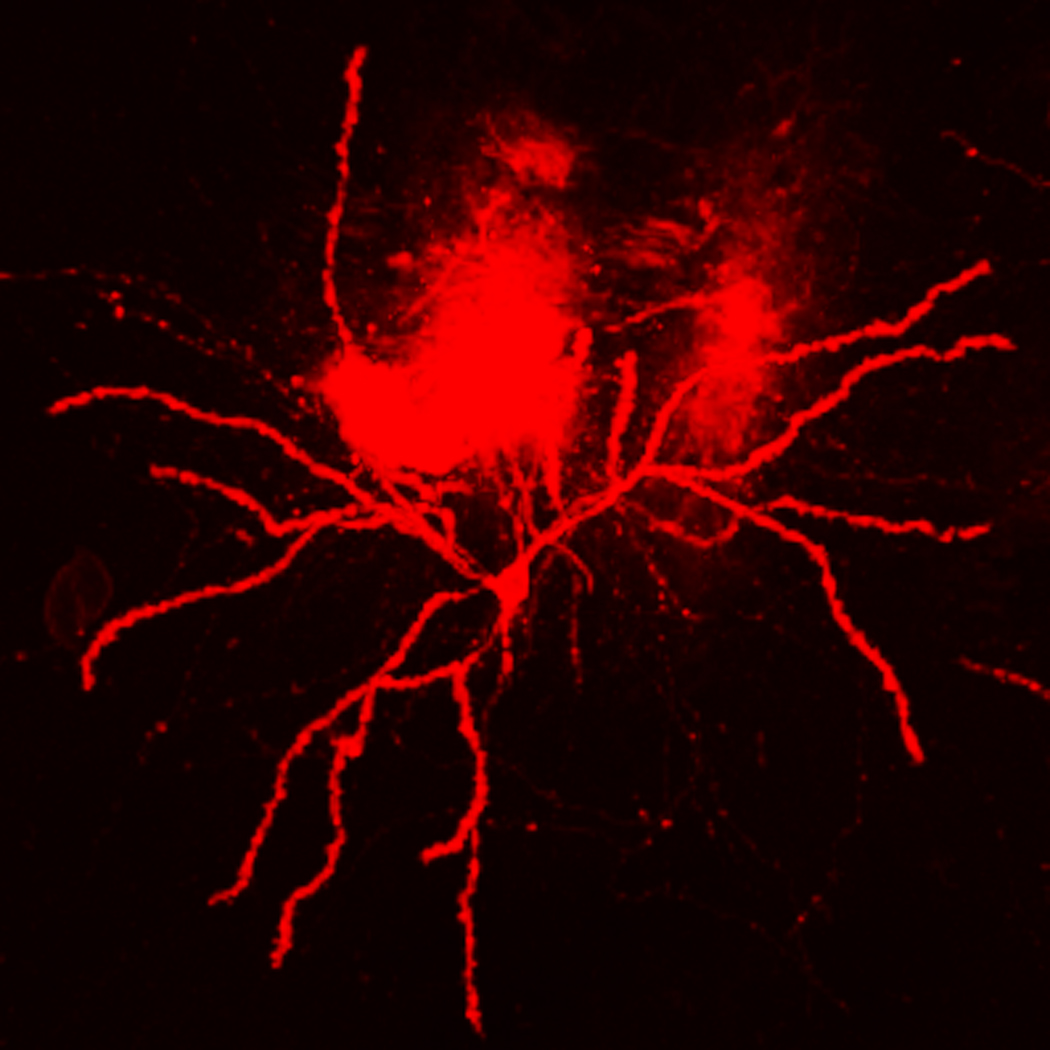
Figure 2.13.8.

This is a low power image that depicts our usual quality of DiOlistic labeling. In the field of view is background fluorescence within the tissue slice, most likely generated by clumps of micro-carriers that were not captured by the mesh filter at the time of delivery. Scale bar = 20 µm (Copyright held by Robert Meisel).
