
Figure 1. FcεRI stimulation of Fyn null MCs reveals altered actin dynamics.
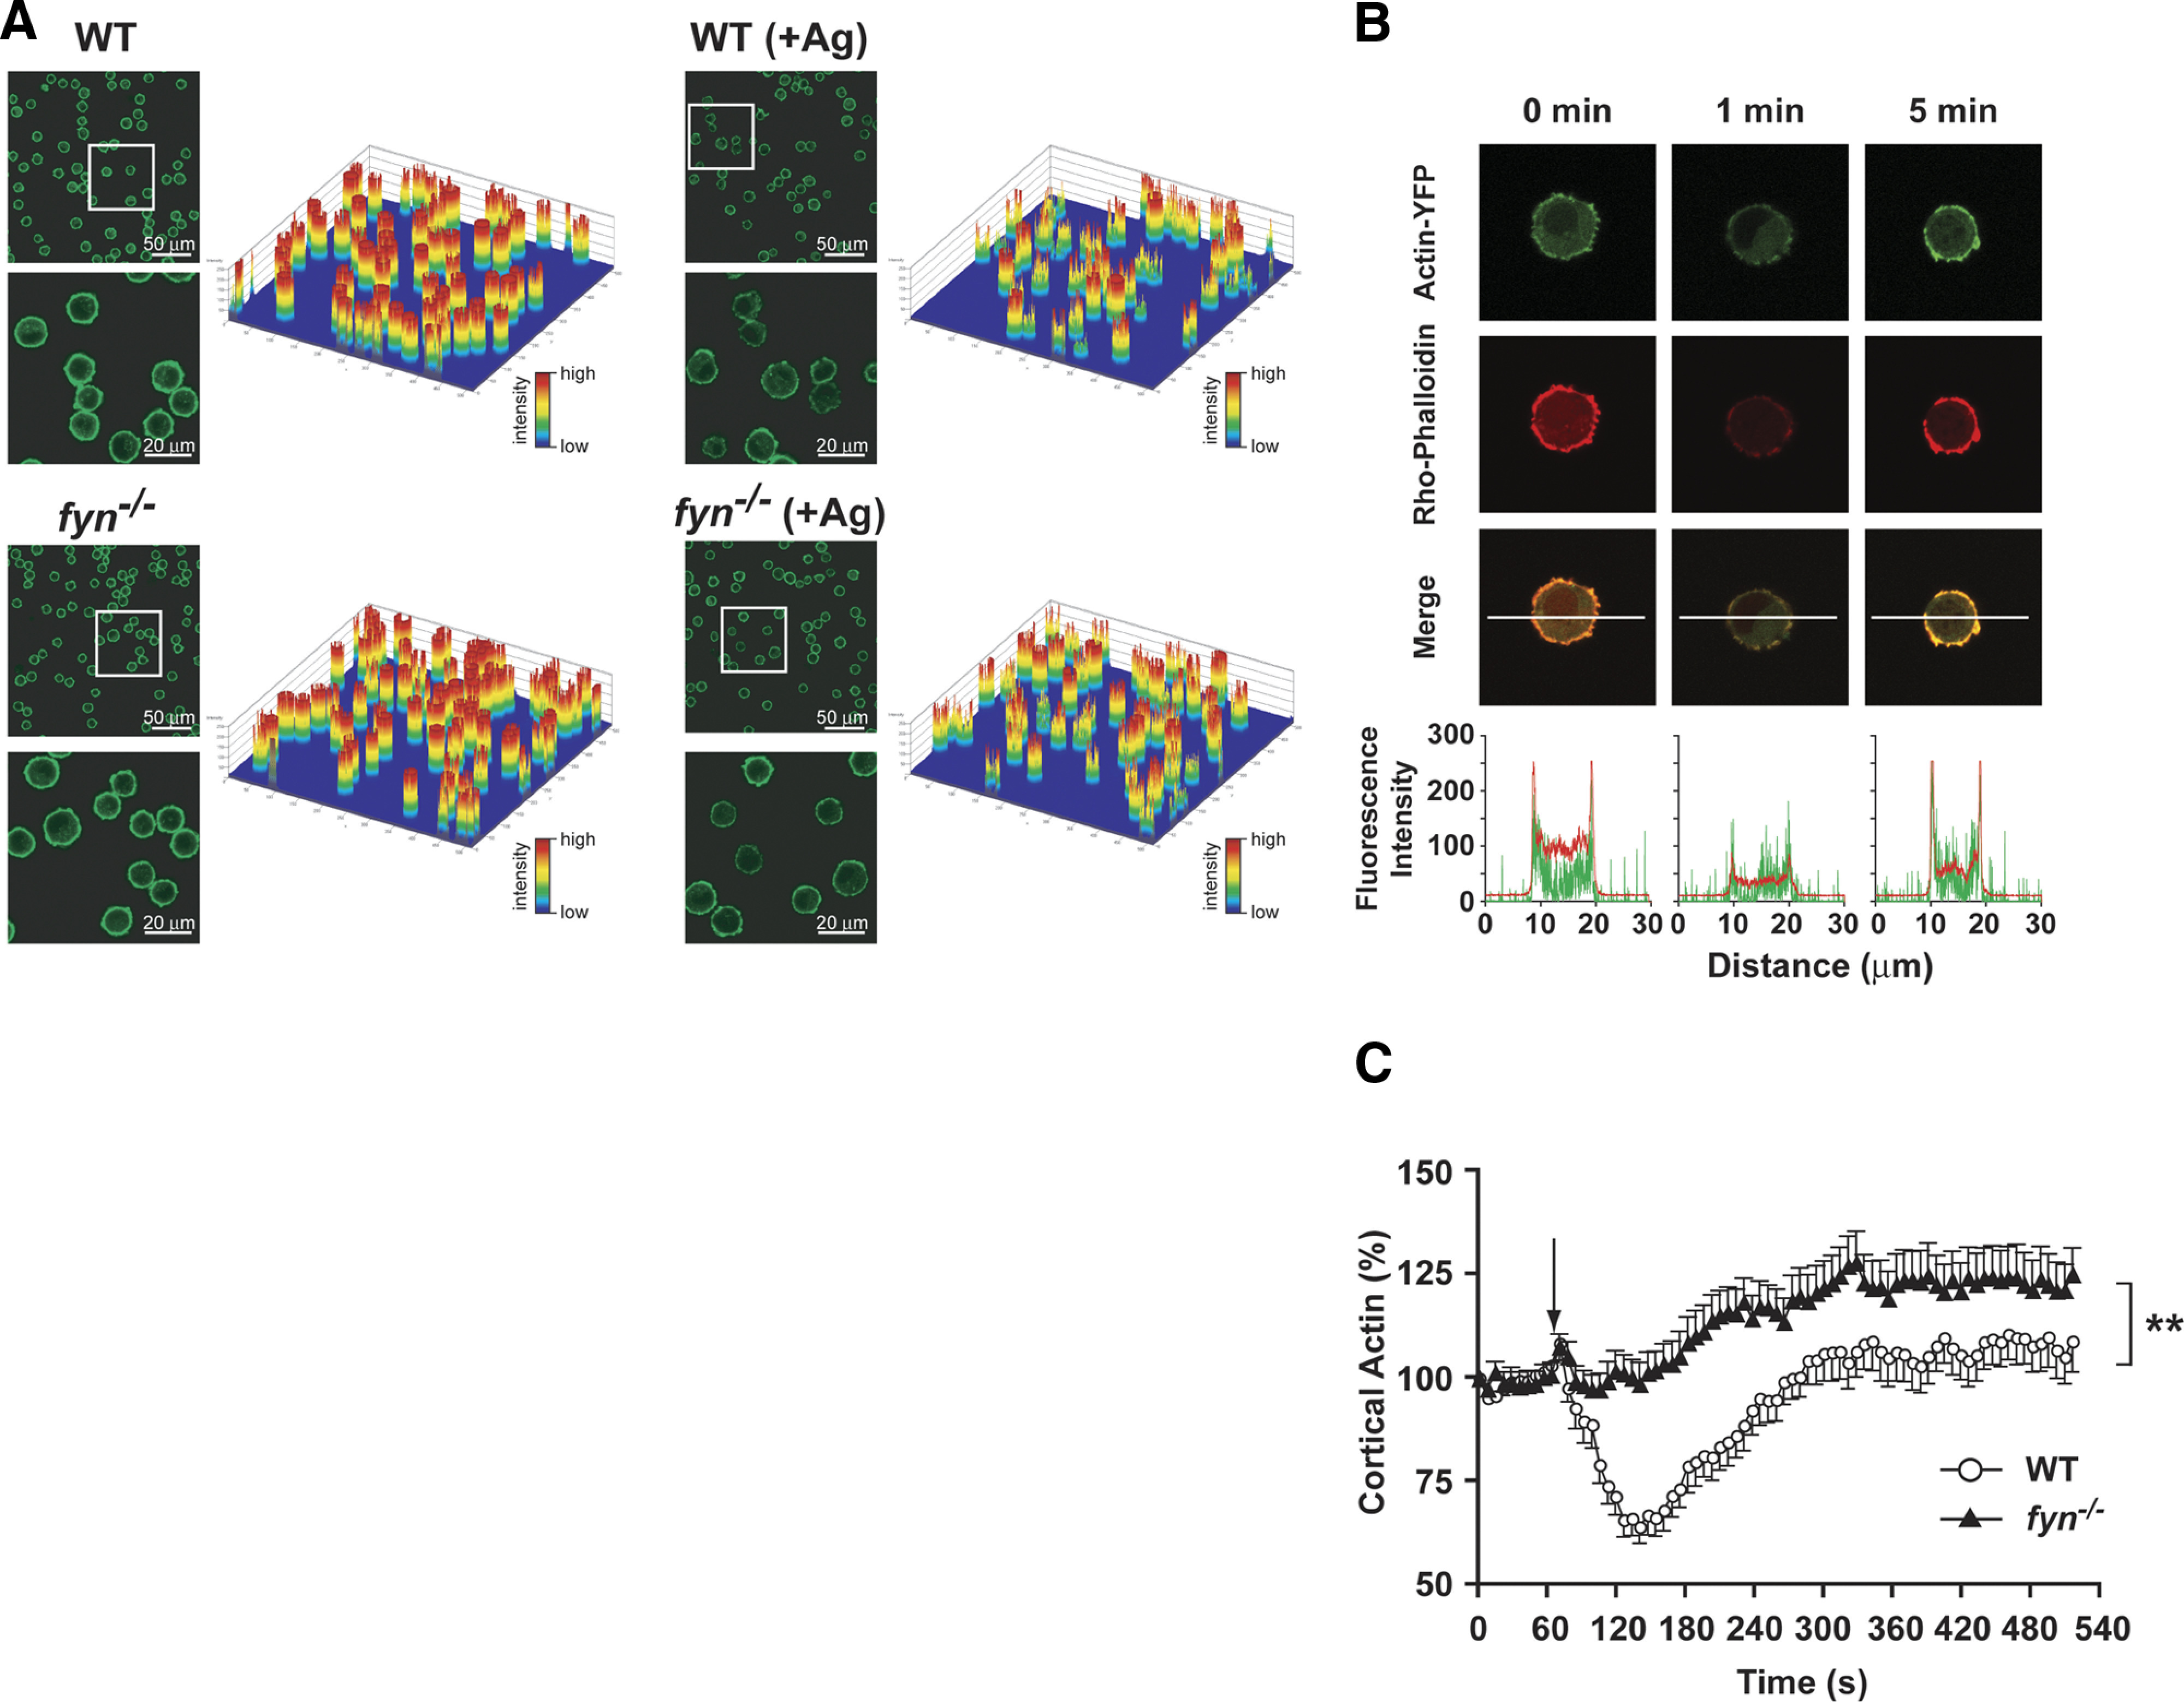
(A) Single cell analysis of actin deploymerization in WT and Fyn null MCs. FcεRI-dependent changes in F-actin content were measured by the amount of fluorescent phalloidin bound to F-actin at the indicated time. The fluoresence intensity of individual cells is shown as an intensity plot. Insets in low-magnification field show the regions selected for higher magnification in the lower panels. One representative of three individual experiments is shown. (B) Distribution of actin-YFP and rhodamine-labeled phalloidin. WT MCs were transiently transfected with actin-YFP (green, top panel) and counterstained with rhodamine-labeled phalloidin (red, middle panel) prior to or after activation with Ag for the indicated time. The merged images (yellow, bottom panel) indicate that actin-YFP and rhodamine-labeled phalloidin were localized predominantly in the cortical region and showed a strong colocalization. Recovery of actin-YFP and rhodamine-labeled phalloidin signals was observed at 5 min poststimulation (intensity profile). (C) Real-time actin-YFP dynamics in WT or Fyn null MCs. Actin dynamics were determined by measuring the amount of fluorescent actin-YFP in the cortical region with time (see Materials and Methods). Arrow indicates the time of Ag addition. Data are mean ± se of 4 individual experiments (23–26 cells were monitored in total). Statistical significance relative to WT cells was **P < 0.01.