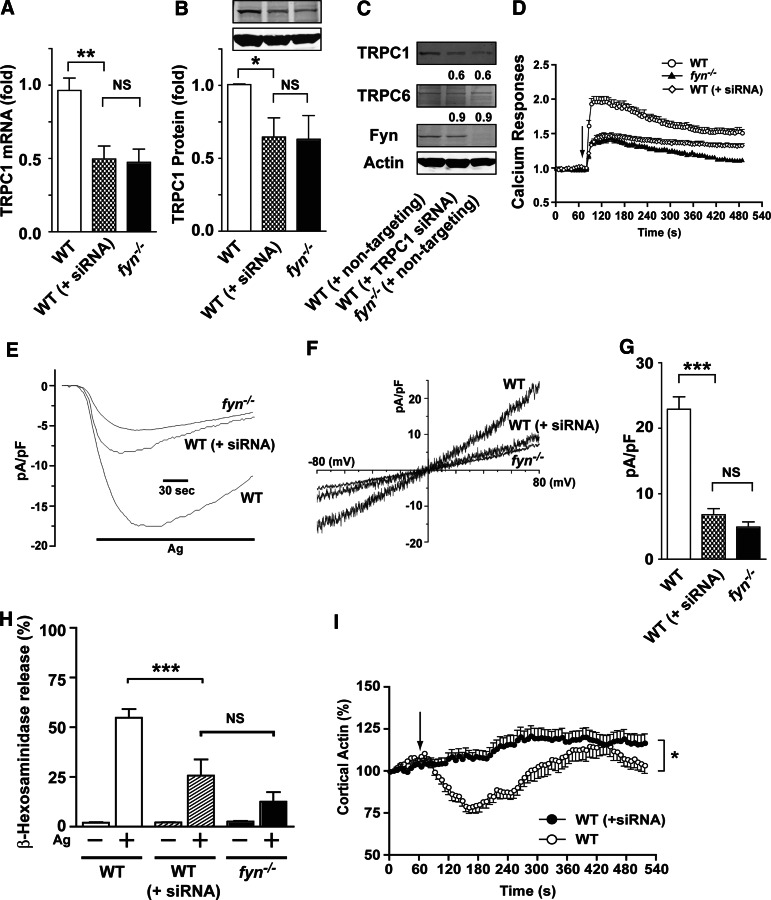
Figure 6. RNAi silencing of TRPC1 expression in WT MCs mimics the functional defects observed in Fyn null MCs.
(A) mRNA levels of TRPC1 in WT, WT MCs treated with TRPC1-specific siRNA [indicated as WT (+siRNA)], and Fyn null MCs were determined by real-time PCR. Data are mean ± se from 3 individual experiments. Statistical significance was **P < 0.01. (B) Expression of TRPC1 protein was determined by Western blots. Data are mean ± se from 4 individual experiments. Statistical significance relative to WT was *P < 0.05. (C) Scrambled sequence siRNA (nontargeting siRNA) was used as a control for WT and Fyn null MCs and showed no effect on TRPC1 or TRPC6 protein expression nor on cellular responses. (D) Calcium responses observed in WT, TRPC1 siRNA WT [WT (+siRNA)], and Fyn null MCs. Calcium was measured as described in Materials and Methods. Graph is representative of 3 independent experiments. Data are mean ± se. (E) Whole cell patch-clamp measurements of WT, TRPC1 siRNA WT, and Fyn null MCs. (F) I–V relationship of the current in WT, siRNA WT, and Fyn null MCs. (G) Mean current densities observed in WT, TRPC1 siRNA WT, and Fyn null MCs. Statistical significance relative to WT was ***P < 0.001. (H) TRPC1 siRNA WT MCs show defective degranulation. Statistical significance relative to appropriate control was ***P < 0.001. (I) Silencing of TRPC1 in WT cells inhibits cortical F-actin depolymerization. An arrow indicates the time of Ag addition. Mean ± se is shown in the graph (15–31 cells were monitored in total). *P < 0.05.

