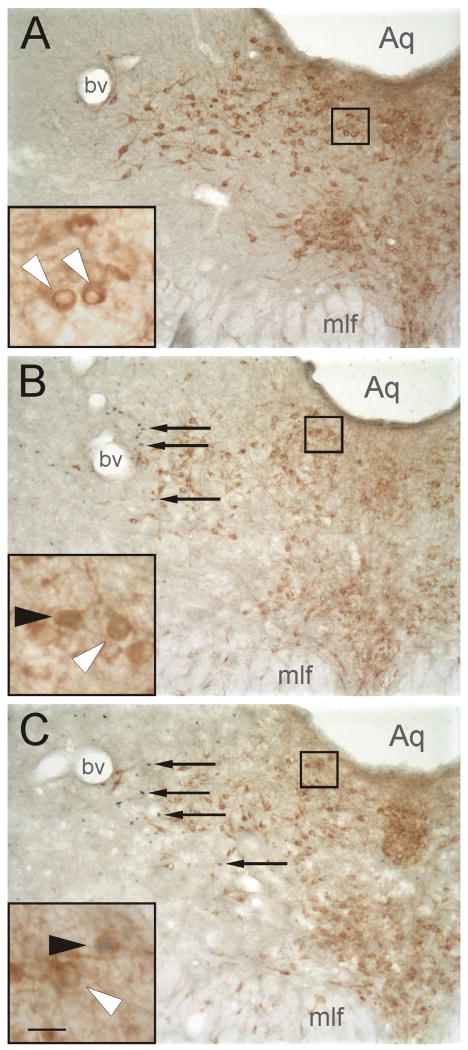
Figure 4.
Photomicrographs illustrating the effects of exposure to the open-field in low-light, or high-light conditions compared to home cage controls, on c-Fos expression in serotonergic and non-serotonergic neurons in the mid-rostrocaudal dorsal raphe nucleus (−8.18 mm Bregma). Photomicrographs illustrate c-Fos-ir nuclei and TrpOH-ir neurons in sections from rats exposed to A) CO, B) LL, C) HL conditions in Experiment 1. Black boxes indicate regions shown at higher magnification in insets in the lower left hand corner of each panel. Arrows indicate examples of c-Fos-ir cells (blue/black nuclear staining); white arrowheads indicate c-Fos-immunonegative/TrpOH-ir (serotonergic) neurons (brown/orange cytoplasmic staining), filled arrowheads indicate c-Fos-ir/TrpOH-ir (double-immunostained) neurons. Abbreviation: Aq, cerebral aqueduct; bv, blood vessel, characteristic of the DRVL region at this rostrocaudal level; mlf, medial longitudinal fasciculus. Scale bar, 100 μm, inset 25 μm.

