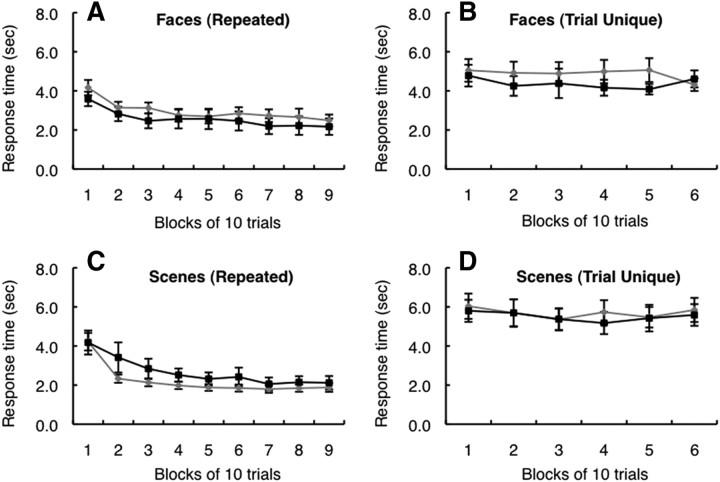
Figure 6.
A–D, Response times of controls (gray lines) and patients with hippocampal lesions (black lines) across all 90 trials in the repeated condition and across all 60 trials in the trial-unique condition. A, C, In the repeated condition, both controls and patients improved their response times during testing. B, D, Neither group exhibited improvement in response time in the trial-unique condition. Error bars show SEM.

