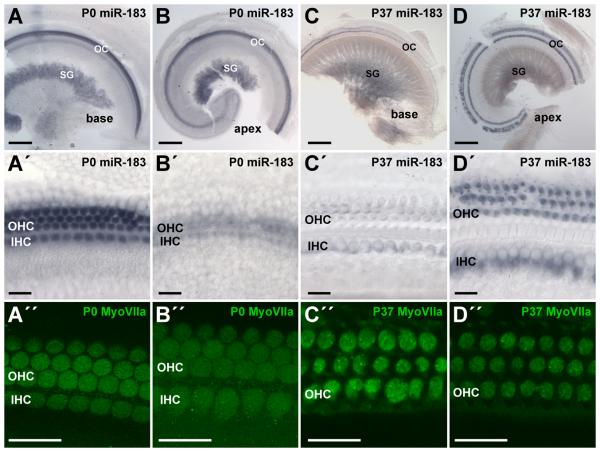
Figure 2.
Expression of miR-183 exhibits temporal changes in longitudinal and radial gradients in postnatal mouse cochlea by in situ hybridization. A-D: Detection of miR-183 in the apex and base of P0 and P37 cochleae. Scale bars represent 200 μm. A′-D′: Corresponding segments of OC in the apex and base. Scale bars represent 20 μm. Intensity of miR-183 detection in hair cells appears as basal>apical and OHC>IHC at P0 versus an apical>basal and IHC>OHC at P37. A″-D″: Immunohistochemical detection of hair cell myosin VIIa in apex and base of P0 and P37 cochleae. Scale bars represent 20 μm. Labels are as described in the legend to Fig. 1.

