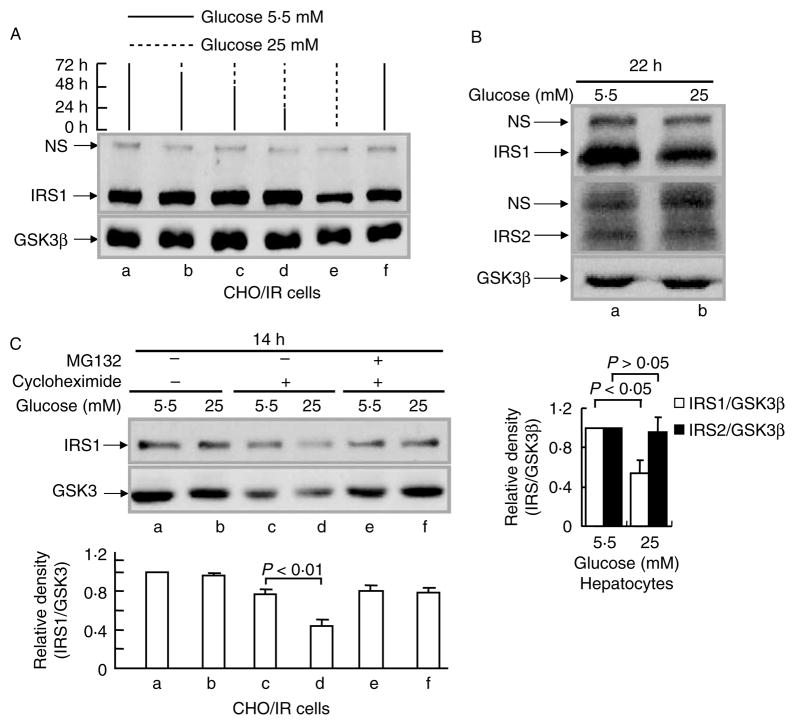
Figure 1.
Effect of high glucose on IRS1 protein levels. (A) CHO/IR cells were incubated in DMEM–0·25% BSA containing 5·5 mM (solid lines) or 25 mM glucose (dashed lines) for the indicated time periods. The medium was refreshed every 24 h. (B) Primary mouse hepatocytes were incubated in DMEM–10% FBS containing 5·5 or 25 mM glucose for 22 h. (C) CHO/IR cells were incubated in DMEM–0·25% BSA containing 5·5 or 25 mM glucose in the presence or absence of cycloheximide (0·5 mM) and MG132 (25 μM) for 14 h. After treatment(s), all cells were lysed in Laemmli sample buffer containing 0·1 M DTT. IRS1 and IRS2 proteins in the cell lysates were detected by immunoblotting analysis using anti-IRS1 and anti-IRS2 antibodies respectively as described in Materials and methods. Results are representative of at least three separate experiments. The densities for western blot bands were quantified by Image J software. The ratio of density for IRS1 and GSK3β proteins was calculated for each lane, and the value for normal (5·5 mM) was considered as 1 and compared with other treatments for each individual experiment. Data are expressed as means±S.E.M., n=3.

