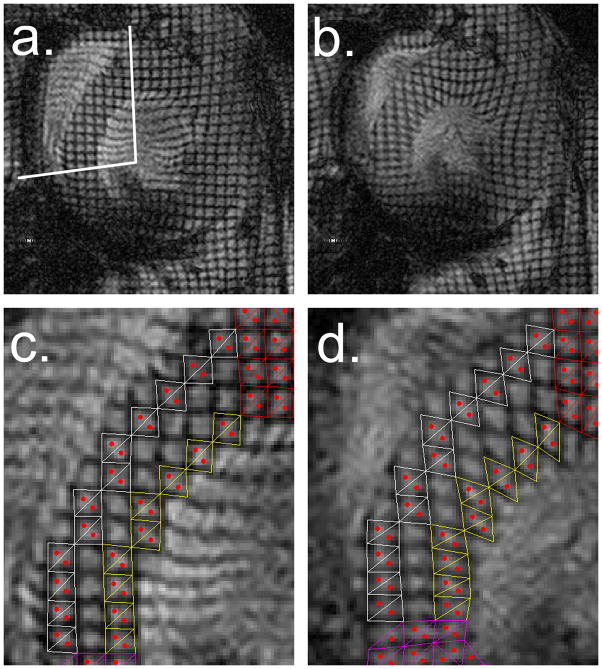
Figure 2.
Representative short-axis, tagged images (0.33×0.33 mm2 grid with 0.1 mm grid line thickness) taken at: a) end-diastole (septal segment marked with white lines), b) end-systole. Zoomed images of septal segment shown at: c) end-diastole and d) end-systole, that display triangulated tagging elements for homogeneous strain measurement from tagged septum superimposed at epicardial (white) and endocardial layers (yellow). Centroids within triangles are marked in red. Note resolution of centroids across septal wall that enable separate analysis of epicardium and endocardium.

