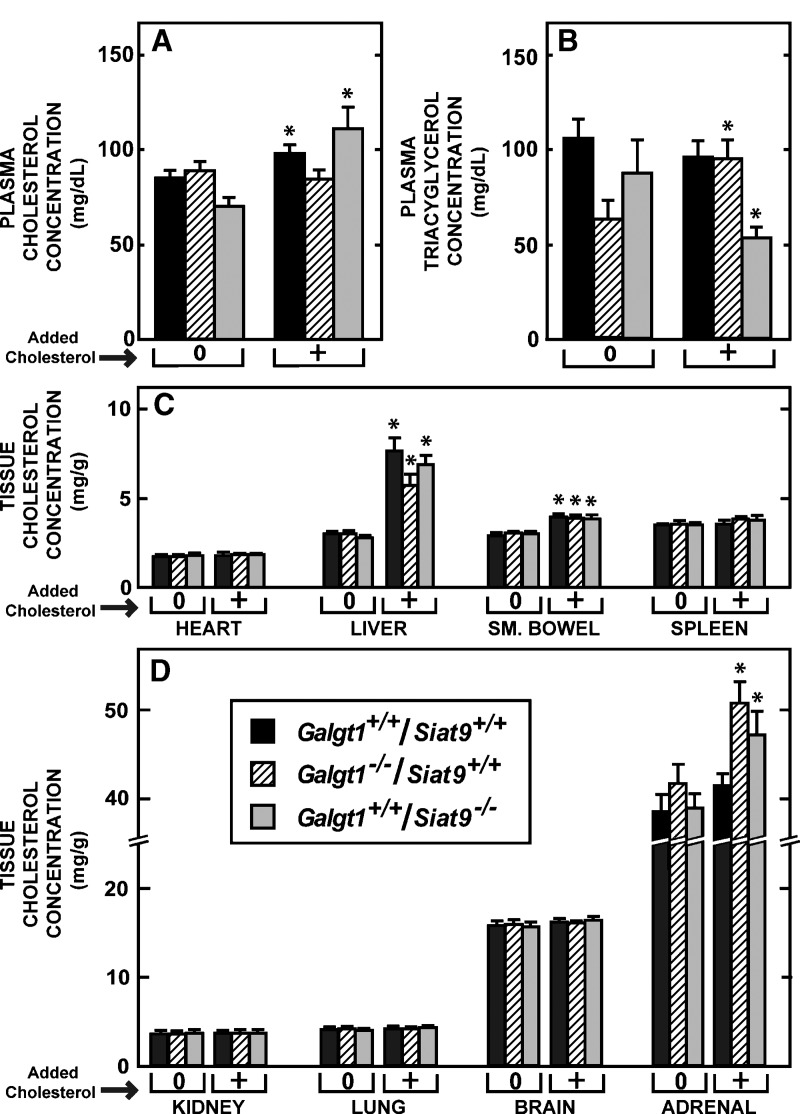
Fig. 5.
Effect of cholesterol feeding on plasma and tissue cholesterol concentrations in female animals lacking GM2/GD2 or GM3 synthase activity. Groups of Galgt1+/+/Siat9+/+ (n = 12 in the low-cholesterol group and 8 in the cholesterol-fed group), Galgt1−/−/Siat9+/+ (n = 8 and 7, respectively), and Galgt1+/+/Siat9−/− (n = 6 and 7, respectively) mice were fed either the low-cholesterol (0.02%) diet or this same diet with added cholesterol (1.0%, “+”) beginning at weaning and continuing until 49 days of age, when the animals were euthanized. A, B: Plasma cholesterol and triacylglycerol concentrations, respectively, in these six groups of animals. C, D: Tissue cholesterol concentrations in the various organs in these respective groups. The asterisk (*) indicates those values in the cholesterol-fed animals that were different (P < 0.05) from the respective values in the mice fed the low-cholesterol diet. Each column represents the mean ± SEM of the values in each group.

