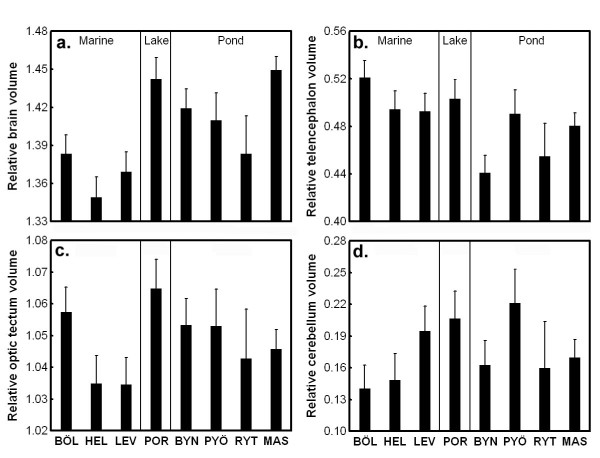
Figure 4.
Population variation in relative brain size and relative size of different brain parts. Least Squares means ± SE are shown. Relative brain size is corrected for standard length and body weight while relative size of different brain parts are corrected for standard length, body weight and brain volume. For population abbreviations, see Fig.1.

