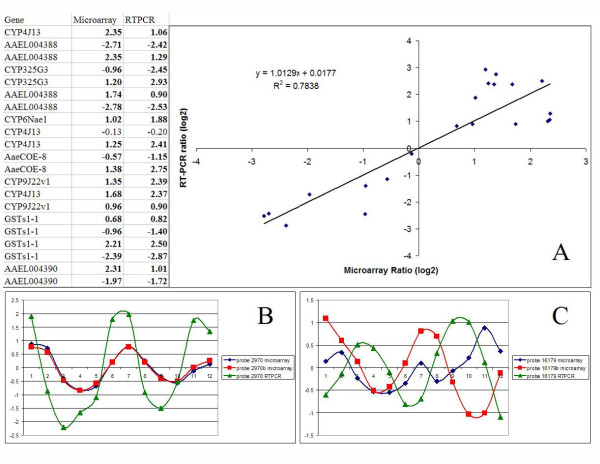
Figure 2.
Validation of microarray expression by RT-PCR. A. Correlation between microarray significant ratios (log2) and average RTPCR ratio values. B. Timeline for microarray (two probes) and RTPCR expression values for AMP-dependent ligase. C. Timeline expression values for the hypothetic protein probe 16179 microarray (two probes) and RTPCR expression values.

