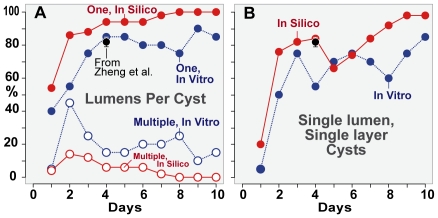
Figure 3. Percentage of cysts with different numbers of lumens.
(A) Percentage of cysts that have single (solid circle) or multiple (open circle) lumens. (B) Percentage of SLSL (single-layer, single-lumen) cysts. Blue: in vitro data for 20 cysts taken each day for ten days. Red: in silico data for 50 cysts using parameters values from Table 2. Black: mean and standard deviation for “normal” MDCK cysts observed by Zheng et al. [6] as described in the text. Solid lines represent continuous growth of ISMA cysts. Dotted lines represent discrete growth of MDCK cysts.

