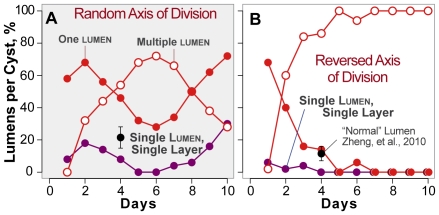
Figure 6. Percentage of ISMA cysts with varied lumen number when the axis of cell division is abnormal.
Shown are the percentages of cysts that have single (solid red circles) or multiple (open red circles) lumens when the axis division is (A) random or (B) reversed (rotated 90°) along with the percentage of cysts that are SLSL (purple circles) when the axis of cell division is (A) random or (B) reversed. Black (A and B): mean and standard deviation for “normal” MDCK cysts observed by Zheng et al. [6]. The in vitro control data are shown in Figure 3.

