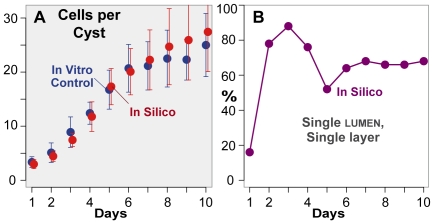
Figure 7. Cystogenesis measures with no luminal cell death.
ISMA simulations executed with the parameter values from Table 2 except that luminal cell death was not allowed. (A) Red: mean values and standard deviations for cell number per cyst. Blue: in vitro control data from Figure 2A. (B) Percentage of SLSL cysts.

