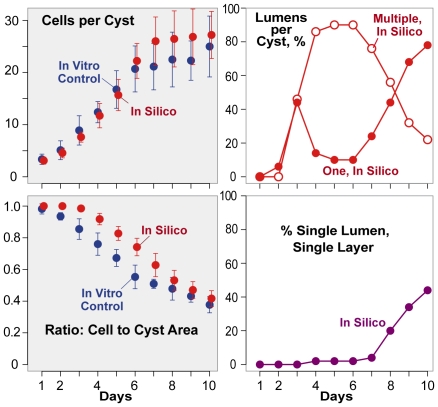
Figure 8. Cystogenesis measures when cell polarization was delayed.
ISMA simulations executed with the parameters values from Table 2 except that cell polarization was delayed as described in the text. Left: mean values and standard deviations for cell number per cyst (top panel) and ratio of cellular to cyst area (bottom panel). Right: Percentage of cysts with single, multiple, and SLSL lumens. Designations and symbols are the same as in Figures 2 and 3.

