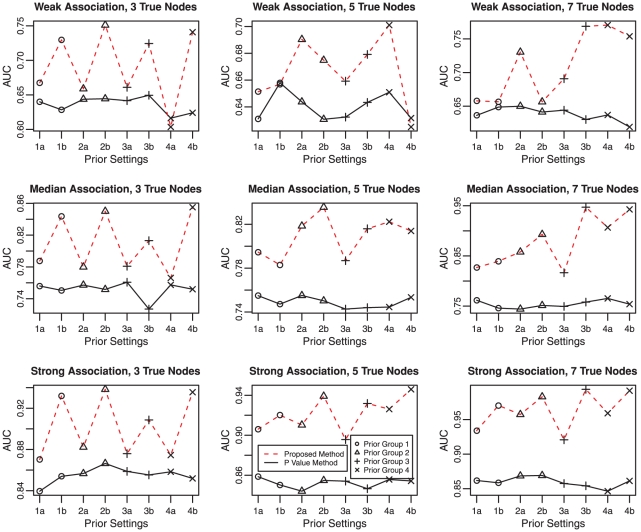
Figure 4. Comparison under different priors.
The three rows of panels are for weak (top panel), median (middle panel), and strong (bottom panel) association signals. The three columns of panels are for three sets of truly associated genes corresponding to three (left), five (middle), and seven (right) nodes, respectively. The dotted lines link AUC of the proposed method and the solid lines connect AUC using  values. Circles, triangles, plus signs and crosses denote prior parameter groups 1, 2, 3, and 4, respectively.

