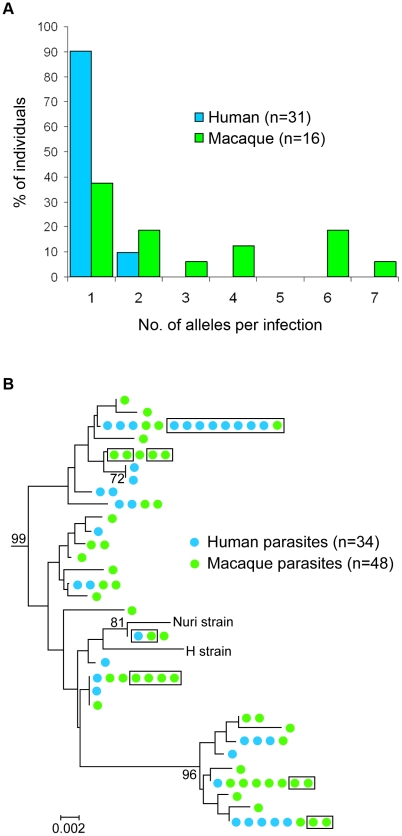
Figure 1. Analyses of P. knowlesi csp gene sequences from infections of macaques and humans.
(A) Histogram showing proportion of human and macaque individuals with different numbers of full length csp alleles detected per infection. (B) Diversity of csp alleles in the P. knowlesi clade of the phylogenetic tree of Plasmodium spp. (Fig. S1), based on the non-repeat region of the gene. These intraspecific relationships clustered by the neighbor-joining method on a Kimura 2-parameter distance matrix represent observed pairwise sequence similarity (phylogeny cannot be determined within the species for a nuclear gene due to recombination). Figures on the branches are bootstrap percentages based on 1,000 replicates and only those above 70% are shown. The horizontal branch lengths indicate nucleotide differences per site compared with the scale bar. Parasite clones in the boxes represent sequences that are completely identical for the whole csp gene (including repeat sequences not analysed by alignment but given separately in Supplementary Table S1).

