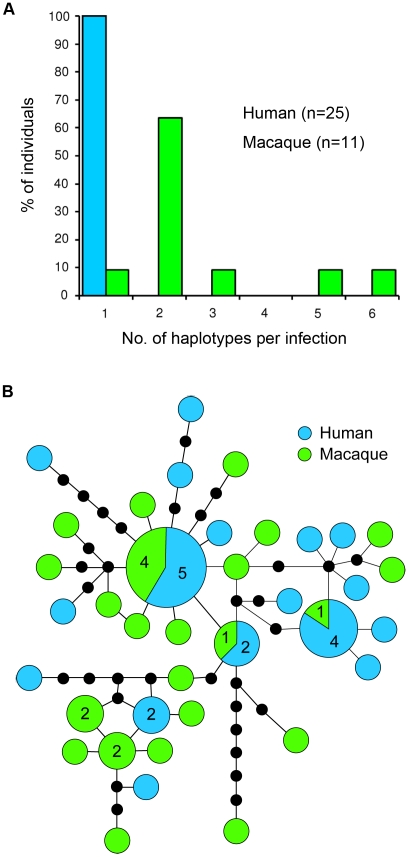
Figure 2. Diversity and haplotype network of P. knowlesi mtDNA genome.
(A) Histogram showing proportion of human and macaque individuals with different numbers of mtDNA haplotypes detected per infection. (B) Schematic diagram of genealogical network showing relationship among 37 mtDNA haplotypes of P. knowlesi. Numbers in larger circles represent number of haplotypes and unnumbered circles represent a single haplotype. Each line connecting the circles represents a mutational step and black dots represent hypothetical missing intermediates.

