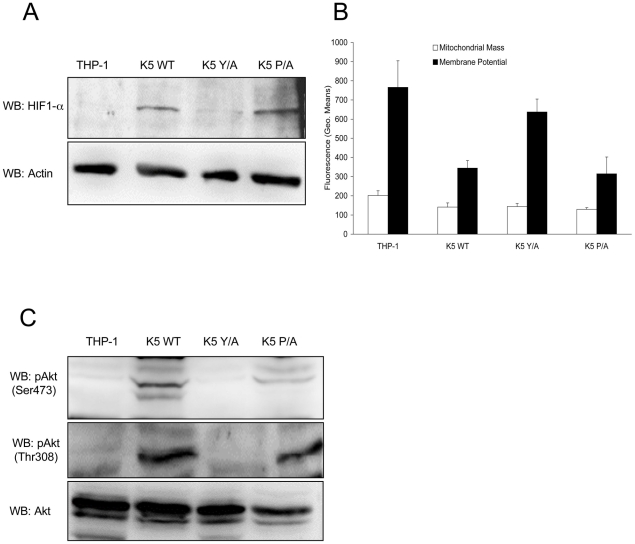
Figure 3. K5 expressing cells have other features of the Warburg Effect.
(A) Normalized whole cell lysate of each of the indicated THP-1 cell lines were subject to western blot (WB) using an anti-HIF-1α antibody (top panel) and re-probed with anti-ß-actin antibodies (bottom panel). (B) Equal numbers of the indicated cell lines were stained with mitotracker green (Mitochondrial Mass) or mitotracker red (Membrane Potential) and subjected to flow cytometric analysis. (C) Normalized whole cell lysates were subjected to western blot (WB) using anti-phospho-Akt (Ser473) (top panel), anti-phospho-Akt (Thr308) (middle panel) or total Akt (bottom panel) antibodies. Data for all panels are representative of three independent experiments.

