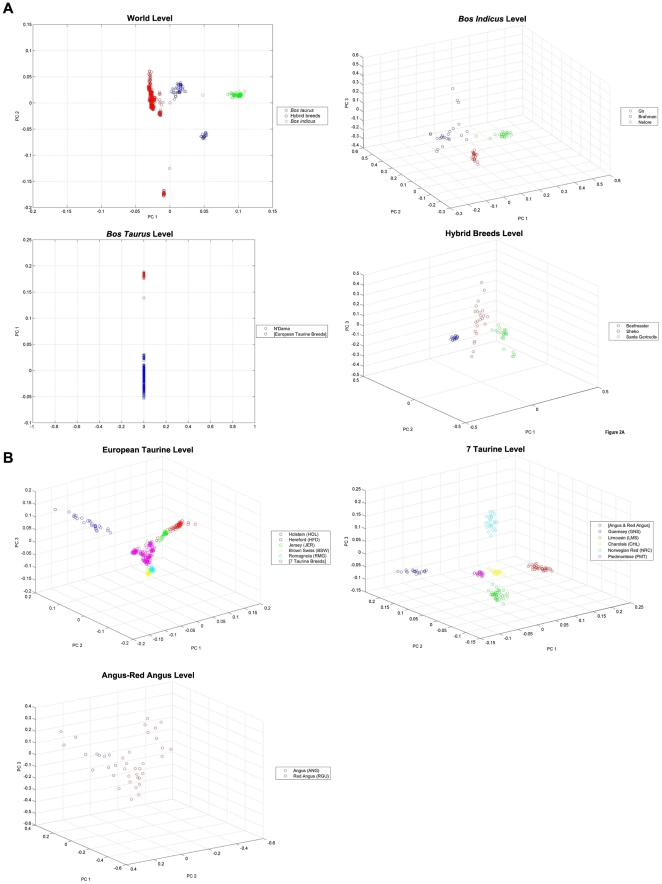
Figure 2. PCA plots.
PCA plots at various levels of the decision tree of Figure 1. (A) Top left: PCA plot at the World node. Top right: PCA plot at the B. indicus node. Bottom left: PCA plot at the B. taurus node. Bottom right: PCA plot at the Hybrids node. (B) Top left: PCA plot at the European Taurine node. Top right: PCA plot at the seven-taurine node. Bottom left: PCA plot at the Angus-Red Angus node.

