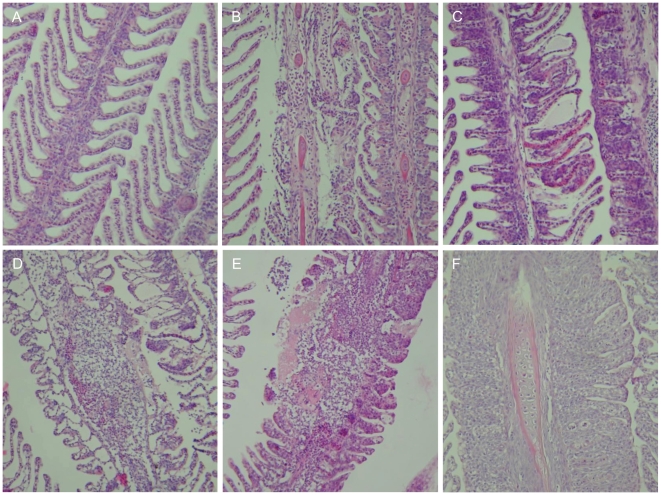
Figure 1. Photographic time series of gill lesions in fish exposed to Aurelia aurita under experimental challenge.
Times expressed in hours from the start of the experiment. A: Healthy gills from control group (0 hr). B–F: Gills from experimental treatment groups. B: 2 hrs. C: 6 hrs. D: 24 hrs. E: 48 hrs. F: 3 wks. Using haematoxylin and eosin at 200× magnification.

