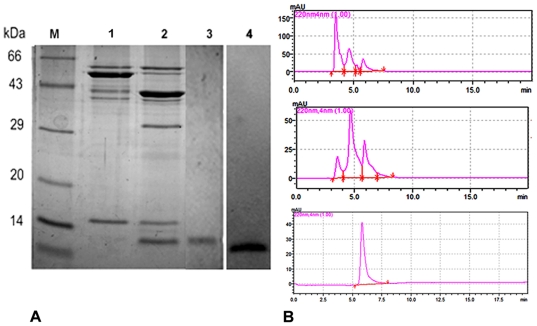
Figure 3. Elution profile and expression analysis of mASAL.
(A) Expression and purification of mASAL in 15% SDS-PAGE analysis; lane 1 represents MBP fusion protein; lane 2 represents fusion protein digested with Factor Xa; lane 3 represents hydroxyapatite column purified mASAL; lane 4 represents Western blotting of purified mASAL against an anti-ASAL antibody showing a band at 12.5 kDa; lane M represents a standard protein molecular weight marker. (B) The corresponding elution profiles from size exclusion chromatography results of the mutant protein from a Biosep-SEC-S-2000 column of Phenomenex at the flow rate 2 ml/min. The figure shows fused mASAL with MBP (pick at 3.5 min), MBP and mASAL after factor Xa digestion (picks at 4.8 min and 6.15 min, respectively) and pure mASAL (pick at 6.1 min).

