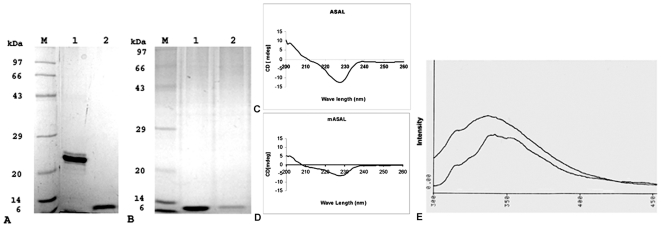
Figure 4. Size determination, Molecular characterization and secondary structure determination of mASAL and ASAL.
(A) Dimeric ASAL and monomeric mASAL were resolved in 15% native gel; Lane 1 represents purified ASAL showing a band in the 25-kDa region, lane 2 represents purified monomeric mASAL with band of size 12.5 kDa. (B) Proteins were resolved in 15% SDS-PAGE, lane 1 and lane 2 represent dimeric ASAL and mASAL, respectively. Both show bands in the 12.5-kDa region. Lane M represents the Standard protein molecular weight marker. Conservation of the secondary structure of (C) ASAL was determined by comparing the circular dichroism spectra with (D) mASAL. CD spectra were recorded over a wave length range of 200 to 260 nm. Spectra were obtained as an average of 10 scans and measured in PBS (pH 7.4) at a temperature of 25°C. The protein concentrations were approximately 0.2 mg/ml in PBS (pH 7.4). (E) Fluorescence spectra of Native ASAL and mASAL, where protein concentrations were 0.15 mg/ml. Excitation was performed at 295 nm and emission was scanned in the wavelength range of 300 to 400 nm. The slight red shift in the fluorescence spectra of mASAL observed was due to a change in the sub-domain organization after C-terminal self assembly in the monomeric form.

