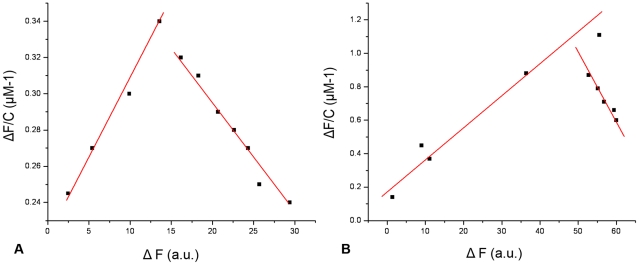
Figure 5. Determination of dissociation constant (Kd) for the interaction of mannose with mASAL and ASAL.
The protein concentration used was 0.15 mg/ml. The dissociation constant was calculated from the linear plot of ΔF/C against ΔF, where ΔF represents the increase or decrease in fluorescence intensity at a given concentration of mannose. (A) and (B) represent the binding of mannose with mASAL and ASAL where the dissociation constants were 0.12 µM and 0.06 µM, respectively.

