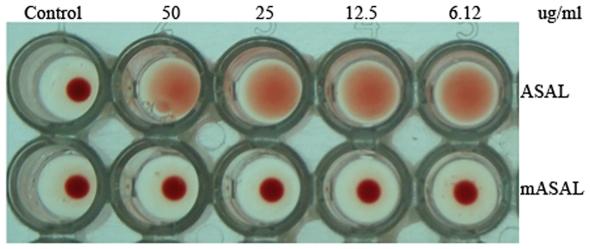
Figure 6. Hemagglutination assay of rabbit erythrocyte with different doses of ASAL and mASAL.
Microtiter wells represent an agglutination pattern of 100 µl of 1% rabbit erythrocytes with various doses of ASAL and mASAL. Well 1 in vertical rows 1 and 2 represent negative controls containing PBS buffer (pH 7.4). Wells 2–5 in vertical rows one and rows two represent ASAL and mASAL with different doses (50 µg/ml to 6.12 µg/ml), respectively.

