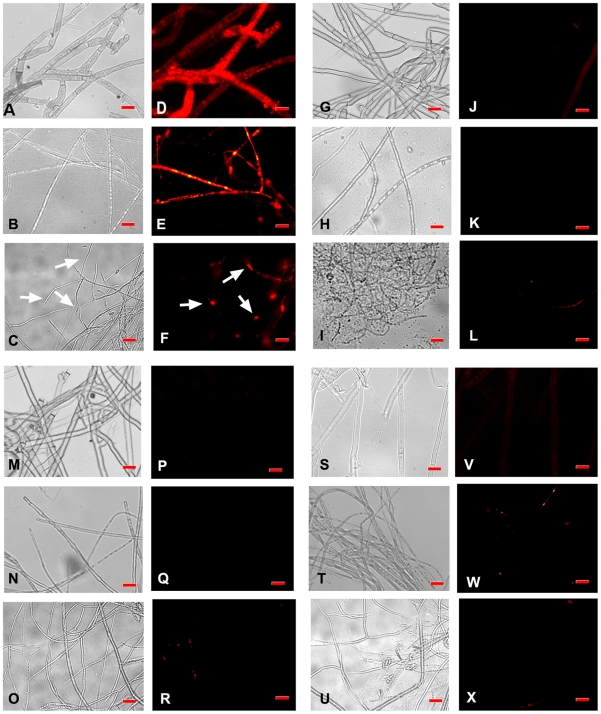
Figure 8. Fluorescent microscopic analysis of a propidium iodide uptake assay.
(A, B, C) and (D, E, F) are respective light microscope images and fluorescent images of mASAL treated R. solani, F. oxysporum and A. brassicicola. (G, H, I) and (J, K, L) are light microscope images and fluorescent images of mASAL pre-saturated with excess α-D mannose treated R solani, F. oxysporum and A. brassicicola, respectively. (M, N, O) and (P, Q, R) are light microscope images and fluorescent images of ASAL-treated R solani, F. oxysporum and A. brassicicola, respectively. (S, T, U) and (V, W, X) are respective light microscope images and fluorescent images of untreated R solani, F. oxysporum and A. brassicicola. Fungi were grown for 40 hours in the presence of mASAL and/or ASAL at peptide concentrations of 4 µg. Untreated fungi were taken as control. Afterwards, fungal hyphae were stained with Propidium iodide for 10 min, washed with 1× PBS, and subjected to fluorescent microscopic analysis. Bar = 15 µm. Images were captured with the AxioCam ICc3 digital camera and AxioVision imaging software system (Carl Zeiss Micro Imaging, GmbH, Germany).

