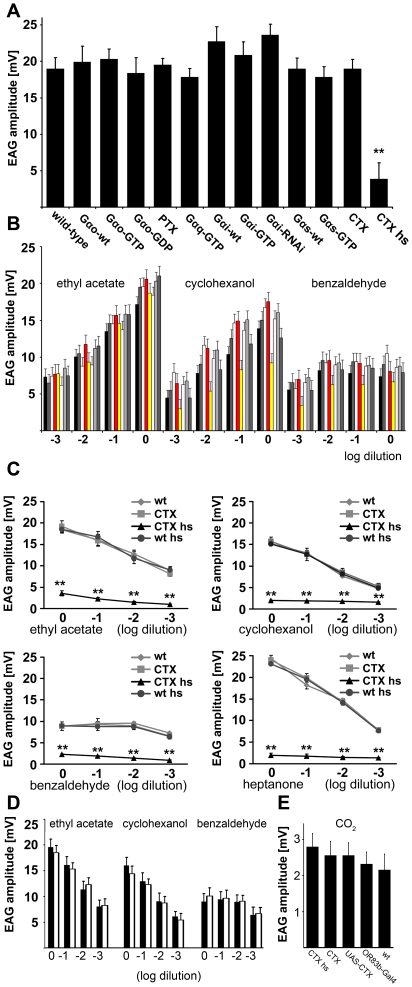
Figure 1. Screening G-proteins for participation in olfactory signal transduction.
(A) UAS constructs of different Gα-proteins, mutated Gα-proteins and G-protein affecting toxins were expressed in the sensory neurons of the third antennal segment using an Or83b-Gal4 driver line, last bars present heat shocked Or83b-Gal4;UAS-CTX flies (CTX hs) and Or83b-Gal4;UAS-CTX flies without heat shock (CTX). EAG amplitudes in response to application of undiluted ethyl acetate were recorded (n>10 flies were recorded). The difference between wt and heat shocked CTX flies was statistically checked by the unpaired Student's t test, **P≤0.01. (B) EAG amplitudes of different G-protein mutant flies (n>10 flies were recorded), expression of UAS constructs were driven by Or83b-Gal4. Odorant used were ethyl actetate, cyclohexanol and benzaldehyde, each in concentrations of 10−3, 10−2, 10−1, and undiluted. The fly strains tested were wt, PTX, Gαs wt, Gαs-GTP (marked in red), Gαq-GTP (marked in yellow), Gαo-GTP, Gαo-GDP, Gαo-wt (from left to right for each odorant dilution). If several doses were tested on the same antenna, lower doses were presented first, inter-stimulus intervals were at least 30 s. Significant differences were only observed for the responses of Gαq-GTP expressing flies towards cyclohexanol and low concentrations of benzaldehyde (shown in more detail in Figure S2A). Flies were statistically checked (pairwise) by unpaired Student's t tests; significance levels were set according to the Bonferroni post hoc test for k = 4 means,*P≤0.0125; **P≤0.0025. (C) EAG amplitudes (in mV) upon exposure to different concentrations of 4 odorants in wt flies, Or83b-Gal4;UAS-CTX flies (CTX), heat shocked Or83b-Gal4;UAS-CTX flies (CTX hs), and heat shocked wt flies (wt hs). The differences between CTX hs flies and wt, wt hs, CTX flies were statistically checked (pairwise) by unpaired Student's t tests; significance levels were set according to the Bonferroni post hoc test for k = 4 means, **P≤0.0025. (D) EAG amplitudes of heat shocked UAS-CTX flies without Or83b-Gal4 driver (white bars) compared to non heat-shocked flies (black bars). (E) EAG amplitudes of heat shocked Or83b-Gal4;UAS-CTX flies (CTX hs, p = 0.04), Or83b-Gal4;UAS-CTX (CTX, p = 0.02), UAS-CTX (p = 0.26), Or83b-Gal4 (p = 0.29), and wt flies to application of CO2 (according to significance levels for k = 5 means, * would have been assigned for P≤0.01). Error bars represent s.e.m.

