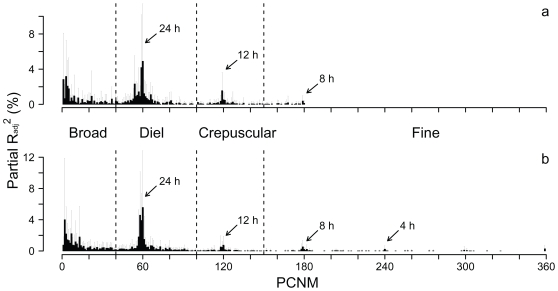
Figure 1. Scalogram based on the average partial Radj 2 distribution of the selected PCNM.
Data for fish tracked in 2003 (a) and 2005 (b) (17 individual fish were used in 2003 and 16 in 2005). PCNM periodicity gradually decreases from the left (PCNM 1) to the right (PCNM 360). For each individual fish, PCNM variables were selected by a forward selection procedure (see text). Error bars represent standard deviation of partial Radj 2 among individuals. Arrows indicate approximate PCNM periodicity. Dashed vertical lines are the boundaries of the four temporal scales used in RDA and PCA analyses (see text for details).

