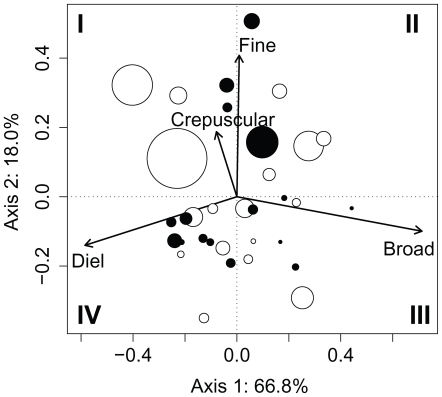
Figure 2. PCA on the RDA residuals (data pooled for the two years) based on the Radj 2 for the PCNMs.
Data are pooled for the four temporal scales (i.e., broad, diel, crepuscular, and fine; see text for details). Roman numerals indicate the four quarters of the ordination plot. Open and filled circles refer to individuals in 2003 and 2005, respectively. Circle size is proportional to the mean daily thermal amplitude (see text for details). The values range from 4.5°C to 11.8°C.

