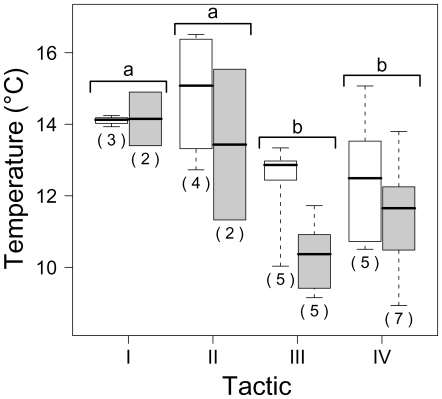
Figure 3. Box plots showing median selected temperature for the two sampling years.
Data (n = 33) are for the four thermal tactics defined by PCA analysis (I–IV; see Figure 2). The whiskers are extended to extreme values. Sample sizes (individual fish) are indicated below each box plot. Thermal tactics with the same letter are not significantly different (post-hoc Tukey test, P<0.05).

