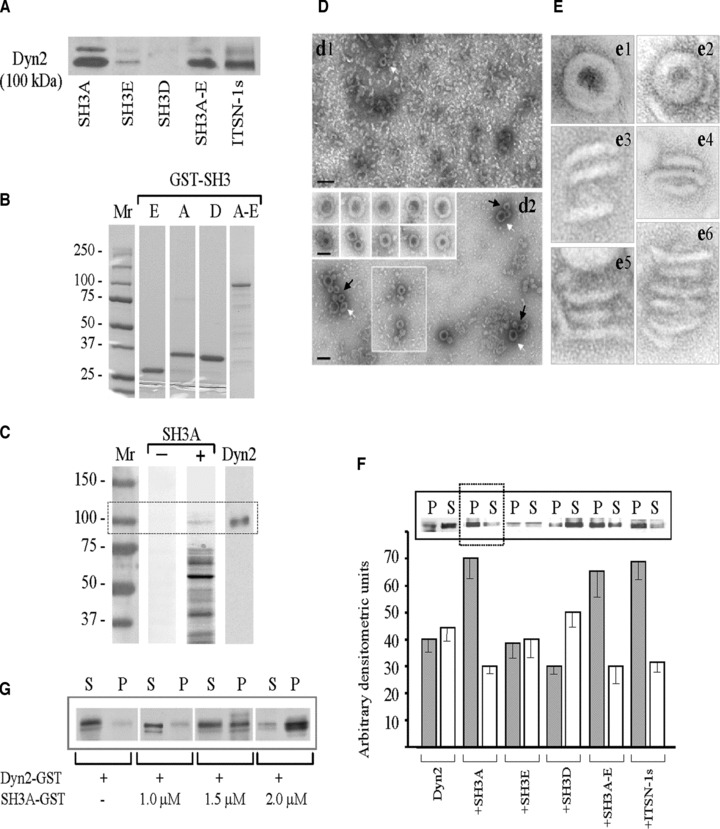
Fig 3.

SH3A stimulates dyn2 oligomerization. (A) SH3 pull-down assays were performed with mouse lung lysates (250 μg total protein) and GST-fusion proteins (∼30 μg) encoding the SH3A, E and D, the SH3A-E complement as well as full-length ITSN-1s, coupled to Glutathione Sepharose beads. The proteins bound to the beads were eluted with SDS-PAGE sample buffer, subjected to electrophoresis and electrotransfer to NC membranes. The membranes were probed with anti dyn pAb. (B) Coomassie staining of a 5–20% SDS-PAGE shows the purity of the GST-SH3 fusion proteins obtained by affinity chromatography on Glutathione Sepharose 4B columns from 1 mM IPTG-induced E. coli lysates. Mr: molecular weight markers. (C) GST-SH3A overlay using nitrocellulose membranes containing the ECs proteins (100 μg), resolved by SDS-PAGE were incubated with the 5 μg GST-SH3A (lane SH3A +); nitrocellulose membranes containing ECs proteins from the same experiment were reacted with anti-dyn Ab (lane Dyn2). A direct interaction between dyn2 and ITSN-1s via the SH3A domain is detected. (D) EM– staining showing that purified dyn2 alone (d1), forms high number of rod-like structures and few characteristic rings (d1, white arrow), under physiological conditions (150 mM NaCl). Representative images show increase in the number of dyn2 rings (d2 and boxed area), and a significant increase in the number of dyn2 spirals (d2, arrows) when GST-SH3A is added. Galleries in the inset show high magnification of dyn2 spirals (upper gallery) and dyn2 rings (lower gallery). Bars: 100 nm (d1, d2); 50 nm (gallery insets in d2). (E) Highly magnified, negatively stained dyn2 structures assembled in the absence (e1, e3, e5) and in the presence (e2, e4, e6) of the GST-SH3A. All images are shown at the same magnification. (F) Affinity purified GST-dyn2 (0.1 mg/ml) was assembled into multimers, in the absence or in the presence of GST-SH3 fusion proteins using a low-ionic strength buffer. Oligomeric structures were separated from soluble dyn2 by centrifugation; the pellet (P) and supernatant (S) were analysed by SDS-PAGE followed by Coomassie Blue staining and densitometry. Under control conditions, dyn2 was found in both P and S fractions, slightly more in the S fraction. When GST-SH3A or GST-tagged full-length ITSN-1s are present, the equilibrium is shifted towards the oligomeric state (P fraction). The histogram represents the average amounts of dyn2 in the P and S factions in four different experiments. Densitometric analysis was performed with ImageJ 1.42l, Image Processing Software. (G) 2 μM GST-dyn2 was incubated for 10 min. at RT with increasing amounts of GST-SH3A at physiological salt (150 mM NaCl) concentrations. Samples were subjected to ultracentrifugation and the pellet (P) and supernatant (S) fractions were analysed by SDS-PAGE and Coomassie Blue staining.
