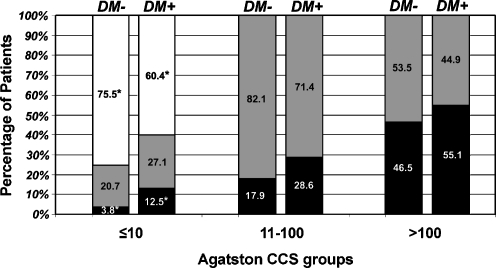
Fig. 4.
Association between the coronary calcium score and coronary artery disease on CTCA. Clustered bar graph of the CTCA findings: normal coronary arteries (□), non-obstructive CAD ( ), and obstructive CAD (■), for patients with (DM+) and without diabetes mellitus (DM-), divided into three groups according to the coronary calcium score (CCS). * = significant differences between diabetics and non-diabetics (p < 0.05)

