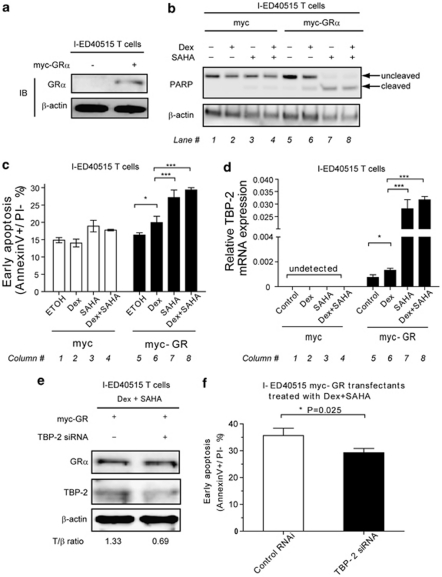
Figure 5.
Forced expression of GR and treatment with SAHA in the late stage of HTLV-I-induced transformation restores GC sensitivity. I-ED40515T cells were transfected with 5 μg of pCMV-tag3B-GRα or pCMV-tag3B control plasmids. (a) At 24 h after transfection, immunoblotting was performed to verify the expression of GRα. (b–d) Then, ethanol vehicle (0.1%, v/v), dexamethasone (1 μ), SAHA (2.5 μ) or dexamethasone (1 μ)/SAHA (2.5 μ) combinations were added, respectively, into cells. (b) Immunoblotting for PARP was performed. β-Actin was used as a loading control. Each lane number was labeled below the blot. (c) Cell pellets were collected and flow cytometry analysis was performed. Each column number was labeled below the graph. (d) Cell pellets were collected to measure TBP-2 mRNA expression by real-time quantitative RT-PCR. Data of relative TBP-2 expression normalized to the glyceraldehyde 3-phosphate dehydrogenase expression are shown. **P<0.01; ***P<0.001. Each column number was labeled below the graph. (e and f) I-ED40515T cells were transfected with 5 μg of pCMV-tag3B-GRα plus TBP-2 antisense oligonucleotides (RNAi no. 2) or control oligonucleotides. At 24 h after transfection, dexamethasone (1 μ)/SAHA (2.5 μ) combinations were added into cells. (e) Immunoblotting for myc-tagged GRα and TBP-2 was performed to verify the transfection and knockdown efficiency. ‘+', RNAi no. 2 added; ‘−‘, control RNAi added. Densitometric ratios of TBP-2/β-actin (T/β) are listed below. Representative data of two independent experiments were shown. (f) Cell pellets were collected and flow cytometry analysis was performed. Data were shown as mean±s.d. in triplicate.

