
Fig. 4.
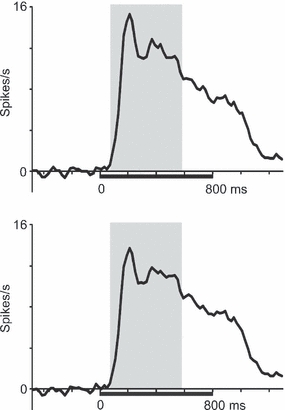
Time-course of averaged responses. First, responses to each stimulus were averaged across trials in individual cells. Then, the difference between the maximum and minimum responses among those to the nine stimuli was averaged over all the responsive cells that showed significant responses to at least one stimulus. The significance of responses was examined by comparing the discharges in the response window from 80 to 580 ms after the first stimulus onset (upper graph) or those in the window from 80 to 880 ms after the first stimulus onset (lower graph) with the discharges in the 500-ms window immediately before the first stimulus onset. The number of cells included in the averaging was 307 for the window from 80 to 580 ms (164 cells from Monkey 1 and 143 cells from Monkey 2), and 343 for the window from 80 to 880 ms (191 cells from Monkey 1 and 152 cells from Monkey 2). The shading indicates the window from 80 to 580 ms.