Fig. 5.

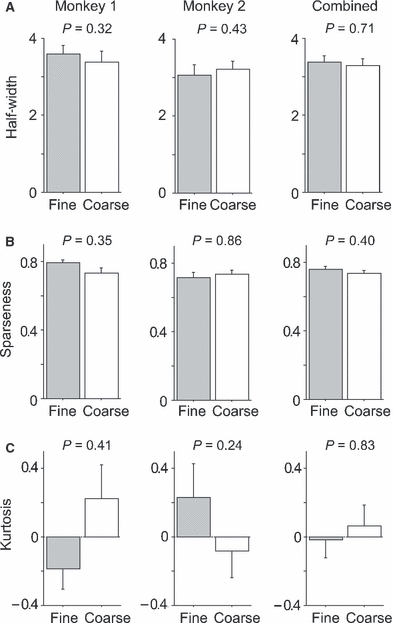
Comparison of half-width (A), sparseness (B) and kurtosis (C) representing selectivity sharpness between two groups of inferotemporal cells recorded in the fine- and coarse-discrimination periods. The error bars represent the SEM.

Comparison of half-width (A), sparseness (B) and kurtosis (C) representing selectivity sharpness between two groups of inferotemporal cells recorded in the fine- and coarse-discrimination periods. The error bars represent the SEM.