
Fig. 6.
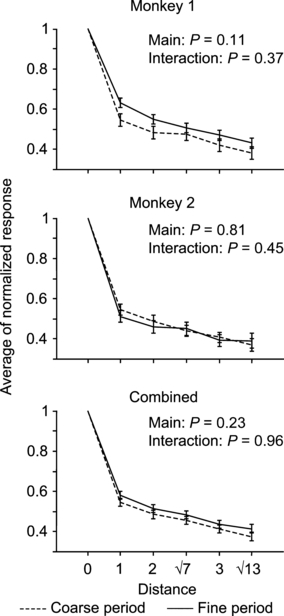
Comparison of tuning curves between two groups of inferotemporal cells recorded in the fine- and coarse-discrimination periods. Responses are plotted against distance of the stimulus from the position of the best stimulus in the parameter space. The responses were first normalized by the maximum response of each cell, and then averaged across cells at each distance. The distance between stimuli within each group was used as the unit of distance. The error bars represent the SEM.