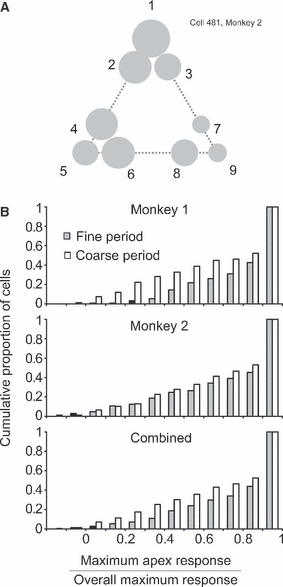
Fig. 7.

Monotonic tuning of responses along the axes in the parameter space. (A) Responses of an example inferotemporal cell recorded during the fine-discrimination period. The size of circles indicates the magnitude of the response evoked by the stimulus at the location. (B) Distribution of the ratio of the maximum among the responses to the three apex stimuli to the maximum response in each cell. The spontaneous activity of the cell was subtracted from both the numerator and denominator before calculating the ratio. The ordinate represents the accumulated number of cells converted to the proportion.
