
Fig. 8.
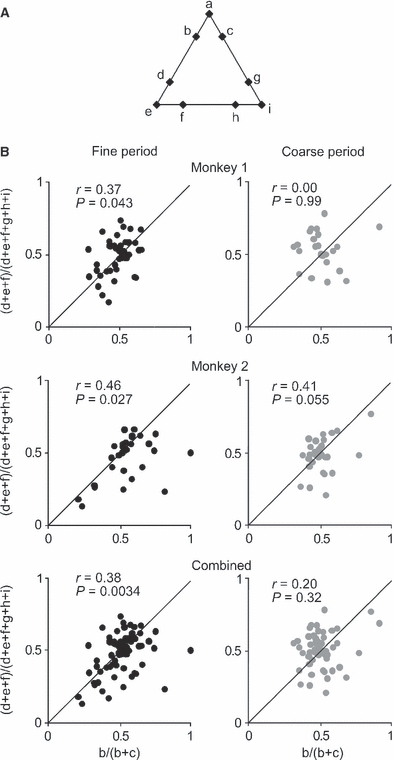
Consistency of differences in responses to stimuli along the two sides of the apex stimulus that evoked the maximum response. (A) The triangular configuration of the stimuli was rotated to place the best apex stimulus at the top (a). (B) The x value of a dot represents the magnitude of response to stimulus b divided by a sum of responses to stimuli b and c. The y value of a dot represents the averaged magnitude of responses to stimuli d, e and f divided by the averaged magnitude of responses to stimuli d, e, f, g, h and i. Only the 130 cells that maximally responded to one of the three apex stimuli are included in this analysis. The left graphs plot 74 cells recorded in the fine-discrimination period (44 in Monkey 1 and 30 in Monkey 2), and the right graphs plot 56 cells recorded in the coarse-discrimination period (24 in Monkey 1 and 32 in Monkey 2).