
Fig. 9.
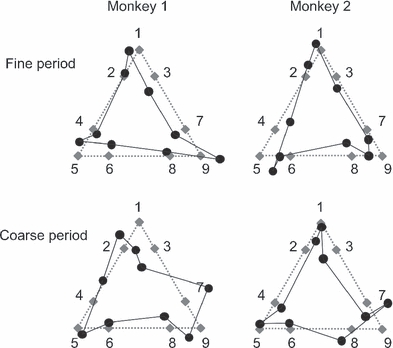
The configurations of the nine stimuli reconstructed from response patterns over the cell populations recorded during the fine-discrimination (top) and coarse-discrimination (bottom) period. The original dimension of the response space was the number of responsive cells recorded during the period, but it was reduced to two by principal component analysis.