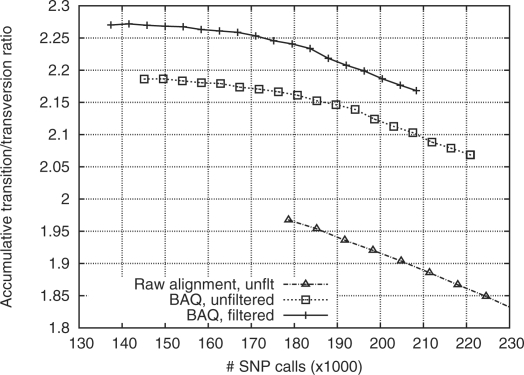
Fig. 2.
Transition–transversion ratio (ts/tv) as a function of the number of SNP calls. SNPs are sorted by the posterior probability of the site being a SNP (SNP probability). Given a threshold on the SNP probability, the number of SNPs of higher probability and their ts/tv are plotted. For the solid line, filters in use are as follows: (i) total depth below 500; and (ii) root mean square mapping quality above 10; (iii) P-value of reference and non-reference bases being evenly distributed on both strands is above 10−4 (by exact test).

