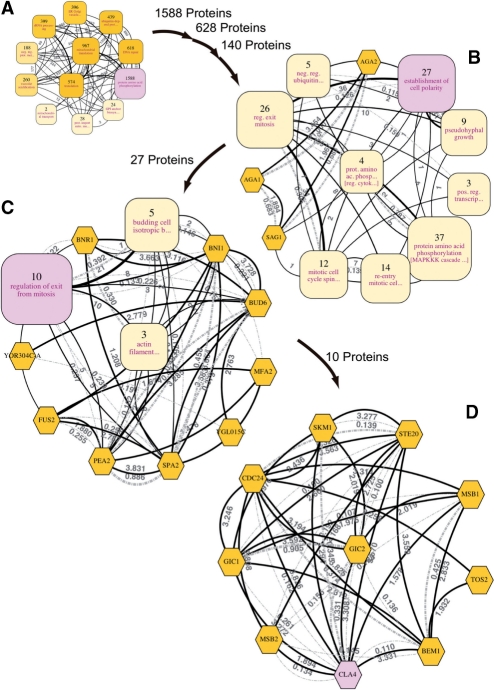
Fig. 3.
Multiscale navigation for a specific protein in a large network. This figure shows the hierarchical organization of the clusters encompassing Cla4, a protein of interest, which are highlighted in pink. The numbers by the arrows indicate the numbers of proteins contained in the processed sub-networks. Hexagons represent proteins that are not contained in any cluster. (A) The most abstract view (same as Fig. 2). Cla4 belonged to the highlighted protein amino acid phosphorylation cluster. After zooming in on this cluster, the clusters containing Cla4 of two deeper views were also the clusters labeled protein amino acid phosphorylation and were excluded for the sake of conciseness. (B) At this level, Cla4 was contained in the establishment of cell polarity cluster. Clusters labeled with the same property terms as those of others are discriminated by additionally displaying the next highest score terms in brackets. (C) Cla4 was contained in the regulation of exit from mitosis cluster. (D) The most specific view. Cla4 was clustered together with Ste20, Gic1, Gic2, Cdc24, Bem1, Skm1, Msb1, Msb2 and Tos2. A large version of this figure is available at Supplementary Figure 3.

